The latest figures show these 11 Milton Keynes neighbourhoods saw an increase in infections in the latest seven-day period, the first week of April.
The other 21 areas of Milton Keynes either saw a fall in case numbers, or their numbers plateau in the latest findings.
Analysts compare infection rates by dividing the country into areas of roughly equal populations then converting the number of new Covid-19 cases into a figure as though each area has 100,000 people in it.
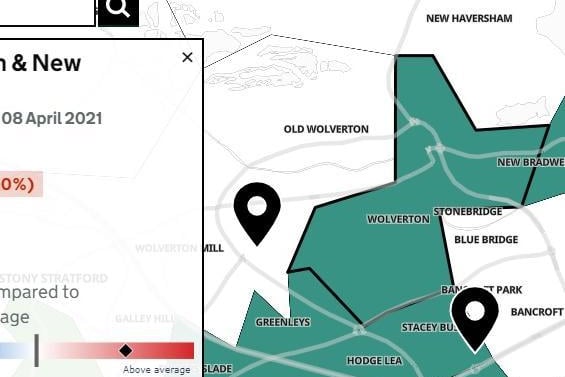
The highest infection rate in the borough was recorded in Wolverton & New Bradwell at 90.7 cases per 100,000 people. For comparison the national infection rate is 27.9 cases per 100,000.
Currently, Milton Keynes' infection rate sits above the national average, at 35.6 cases per 100,000.
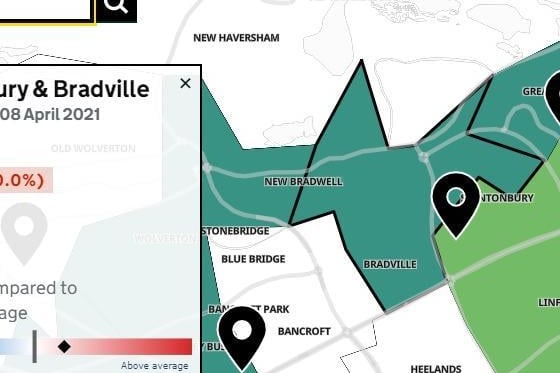
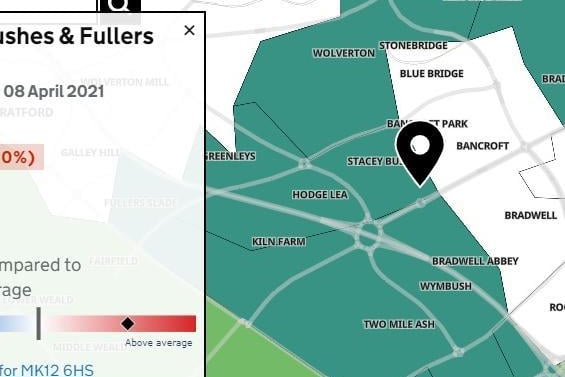
Coronavirus figures can be checked using an interactive map available on the Government's website here.
Now with gyms, bars and restaurants opening up to customers again, we reveal which neighbourhoods saw the biggest rise in case rates per 100,000 people between 1 and 8 April.