


The average house price fell in all but 12 out of 35 neighbourhoods across Milton Keynes, according to the latest figures published by the Office for National Statistics.
But there was one area where prices remained unchanged, and 11 where house prices rose - by up to 12.5 per cent in a year.
Below are all the neighbourhoods across Milton Keynes where the average house price rose during the 12 months to September 2024, the latest date for which localised data is available.
They are listed in reverse order, from smallest to biggest percentage annual house price increase.
The data is taken from neighbourhood statistics published by the Office for National Statistics in March 2025, for the period up to September 2024.
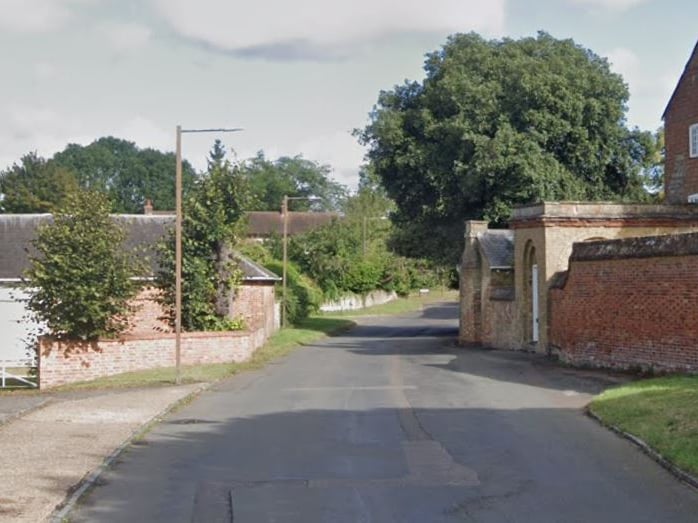
9. Bradwell Village - 8.4%
In Bradwell Village, the average house price rose by 8.4% to £322,500 during the year ending in September 2024. That was the third biggest percentage rise of any neighbourhood in Milton Keynes. | Google Photo: Google
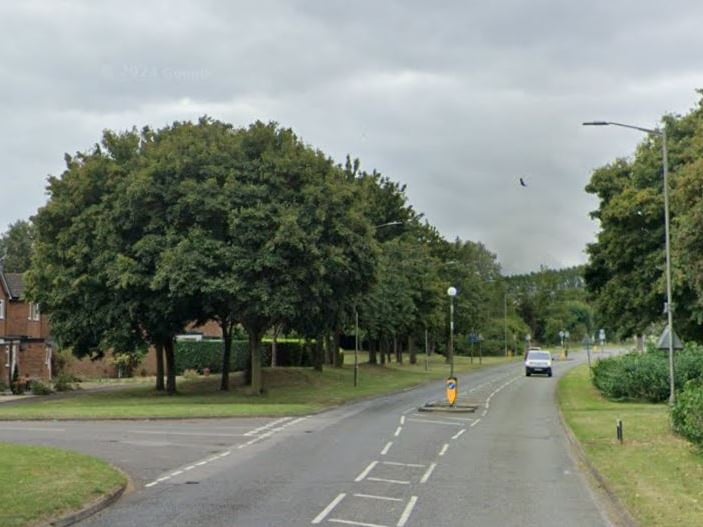
10. Newport Pagnell South - 10.5%
In Newport Pagnell South, the average house price rose by 10.5% to £321,500 during the year ending in September 2024. That was the second biggest percentage rise of any neighbourhood in Milton Keynes. | Google Photo: Google
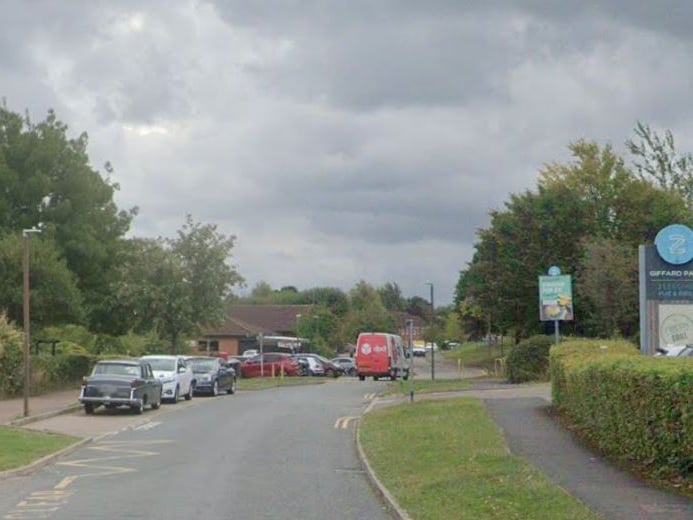
11. Great Linford & Giffard Park - 12.5%
In Great Linford & Gifford Park, the average house price rose by 12.5% to £360,000 during the year ending in September 2024. That was the biggest percentage rise of any neighbourhood in Milton Keynes. | Google Photo: Google