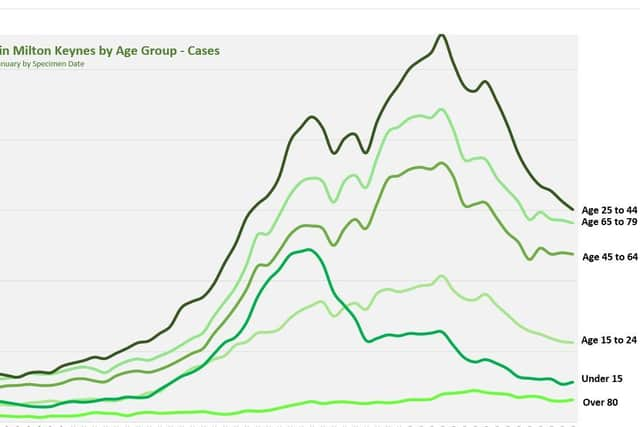
Is lockdown in Milton Keynes working? Here are the neighbourhoods where Covid infections are falling the fastest
and live on Freeview channel 276
The Citizen has compared the number of Covid cases seen in each postcode area then to the number recorded today.
And our research shows every area has seen a pleasing decrease, with many demonstrating quite a dramatic drop.
Advertisement
Hide AdAdvertisement
Hide AdAt the start of lockdown, two districts - Shenley Wood and Grange Farm and Broughton, Middleton and Kents Hill were recording cases by the hundred. Both these areas house care homes for the elderly, and their figures have always been high.


But both have now shown significant drops, with Broughton, Middleton and Kents Hill going from 217 cases to 94.
In some places such as Newport Pagnell, Stony Stratford, Bletchley Olney, Bradwell Common and Westcroft, cases have more than halved.
The smallest decreases have been in Bletchley South, which had 82 cases on January 5 and 72 today, and Oldbrook and Coffee Hall, where there were 53 cases three weeks ago and 51 today.
Advertisement
Hide AdAdvertisement
Hide AdThe first day of lockdown saw a record 494 people test positive for Covid-19 in Milton Keynes. The infection rate was spiralling so rapidly that the city had been declared a Major Incident area the day before Boris Johnson made his lockdown announcment.
At that time MK's infection rate - the number of cases per 100,000 population - was 893.3. The following week it peaked to over 1,000, but then slowly the figures started to stabilise.
Today our case rate stands at 470.6 cases per 100,000 of the population. This is still higher than the rate for England, which today is 386.8 cases per 100,000 people.
Sadly, Covid-linked deaths have not reduced. In fact, during lockdown they have risen to more than 30 a week, bringing the current total to 375 since the start of the pandemic.
Advertisement
Hide AdAdvertisement
Hide AdThese are all people who have died within 28 days of receiving a positive Covid test, so many would have caught the virus before lockdown began or at the start of lockdown. It is hoped deaths will soon start to decrease alongside the case rates.
Here we reveal the case numbers for each postcode area in MK. The figure is the number of cases in the week ending January 5. The second is the number of cases in the seven day period ending January 22. These are the government's most recent figures.
Newton Longville & Great Horwood - 23 down to 6
Furzton - 80 down to 34
Stacey Bushes & Fullers Slade - 55 down to 29
Walnut Tree & Tilbrook - 45 down to 26
Linford Wood - 63 down to 40
Bradwell Village - 54 down to 29
Newport Pagnell North - 61 down to 26
Bletchley North West - 79 down to 48
Willen & Downhead Park - 57 down to 25
Newport Pagnell South - 61 down to 27
Bradwell Common - 62 down to 28
Olney & Lavendon - 30 down to 19
Bletchley East - 97 down to 44
Bletchley West - 59 down to 33
Central Milton Keynes & Newlands - 84 down to 53
Hanslope, Castlethorpe & Sherington - 59 down to 21
Two Mile Ash - 65 down to 24
Great Linford & Giffard Park - 63 down to 35
Westcroft & Shenley Brook End - 102 down to 39
Oldbrook & Coffee Hall - 53 down to 51
Eaglestone & Fishermead - 77 down to 54
Tattenhoe & Emerson Valley - 75 down to 54
Woughton & Woolstone - 70 down to 37
Denbigh - 60 down to 48
Far Bletchley - 76 down to 43
Stony Stratford & Old Wolverton - 60 down to 30
Bletchley South - 82 down to 72
Shenley Wood & Grange Farm - 143 down to 85
Broughton, Middleton & Kents Hill - 217 down to 94
Loughton - 59 cases down to 26
Wolverton and New Bradwell - 59 cases down to 31
Stantonbury and Bradville - 78 down to 34